BestCalcHub
BestCalcHub
Online calculators
Engineering8 min read

Pump Flow Rate vs Pump Head

Understand how pump flow rate and pump head work together through pump curves, system resistance, operating point, and Best Efficiency Point.

By MuneebPublished 2026-08-13Updated 2026-08-13
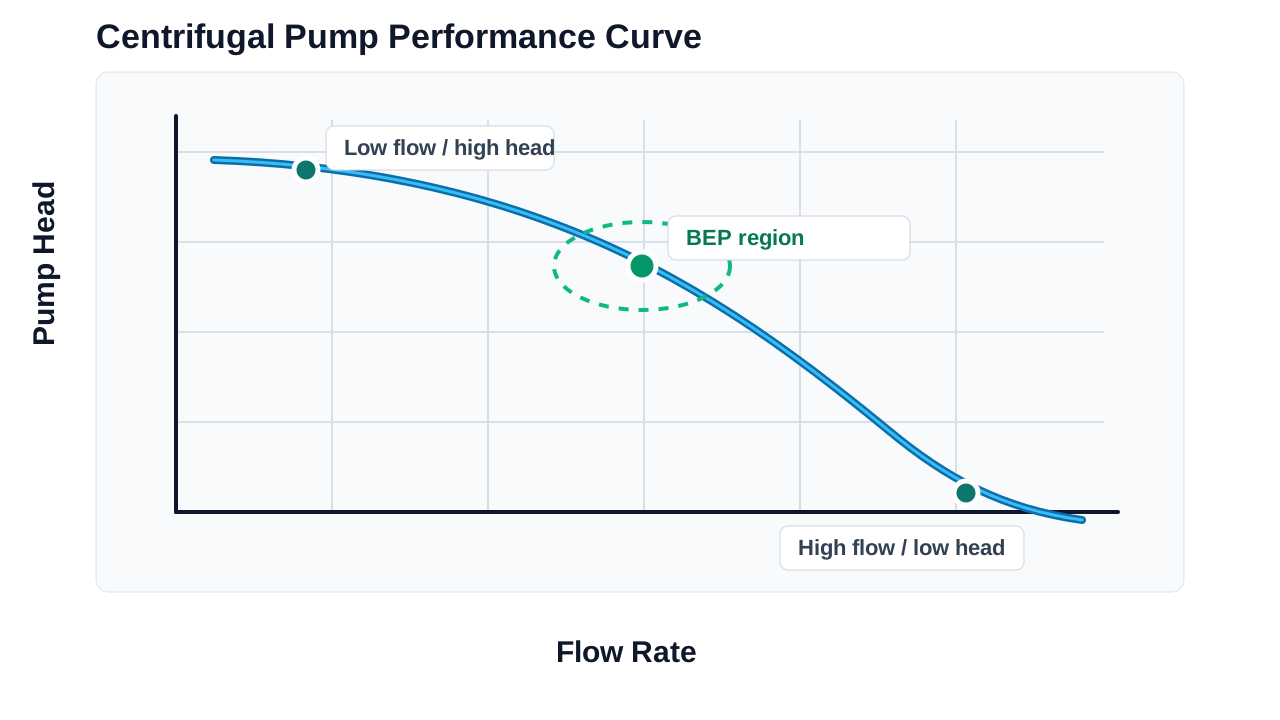
Centrifugal pump curve showing the relationship between flow rate and pump head
A centrifugal pump usually delivers less available head as flow rate increases.

Pump flow rate and pump head are two of the most important values used when evaluating centrifugal pump performance.

Flow rate describes how much fluid the pump delivers over a given period of time, while pump head represents the energy the pump adds to the fluid. These two values are closely connected, so a pump cannot usually deliver the same flow at every possible head.

Understanding this relationship is important when checking whether a pump can actually meet the required operating conditions. For a quick preliminary flow calculation, use the Pump Flow Rate Calculator.
What Is Pump Flow Rate?

Pump flow rate is the volume of fluid delivered by the pump per unit of time.

Common units include GPM, LPM, L/s, and m3/h. Flow rate tells you how much fluid is moving.

For example, a flow rate of 100 L/min means the system is delivering an average of 100 liters of fluid every minute under the stated operating condition.

Flow rate is an important pump-selection parameter, but it is not enough on its own.

  • GPM
  • LPM
  • L/s
  • m3/h

What Is Pump Head?

Pump head describes the energy added by the pump to the fluid and is commonly expressed in meters of fluid or feet of fluid.

Pump head is related to the pressure and energy requirements of the system.

A pump may need to provide head to overcome elevation differences, pressure requirements, pipe friction, valves, fittings, and other system resistance.

This means a pump with a high maximum flow rating does not necessarily deliver that flow when the system requires a high head.

  • Elevation differences
  • Pressure requirements
  • Pipe friction
  • Valves and fittings
  • Other system resistance

Why Flow Rate and Pump Head Are Connected

Centrifugal pump curve showing the relationship between flow rate and pump head
Lower head generally allows higher flow, while higher head usually reduces available flow.

A centrifugal pump generally operates along a performance curve.

At a lower system head, a pump can often deliver a higher flow rate. As the required head increases, the available flow rate usually decreases.

The basic relationship is simple: higher head generally means lower available flow, and lower head generally means higher available flow.

The exact relationship depends on pump design, speed, impeller, and operating conditions. This is why a pump should be evaluated at the actual combination of flow and head required by the system.

What Is a Pump Performance Curve?

A pump performance curve shows how a particular pump performs under different operating conditions.

The curve commonly relates flow rate on the horizontal axis to pump head on the vertical axis.

Additional curves or information may also show efficiency, shaft power, and NPSH required.

The manufacturer curve is important because it shows what the selected pump can actually deliver at different operating conditions.

  • Flow rate
  • Pump head
  • Efficiency
  • Shaft power
  • NPSH required

The Operating Point

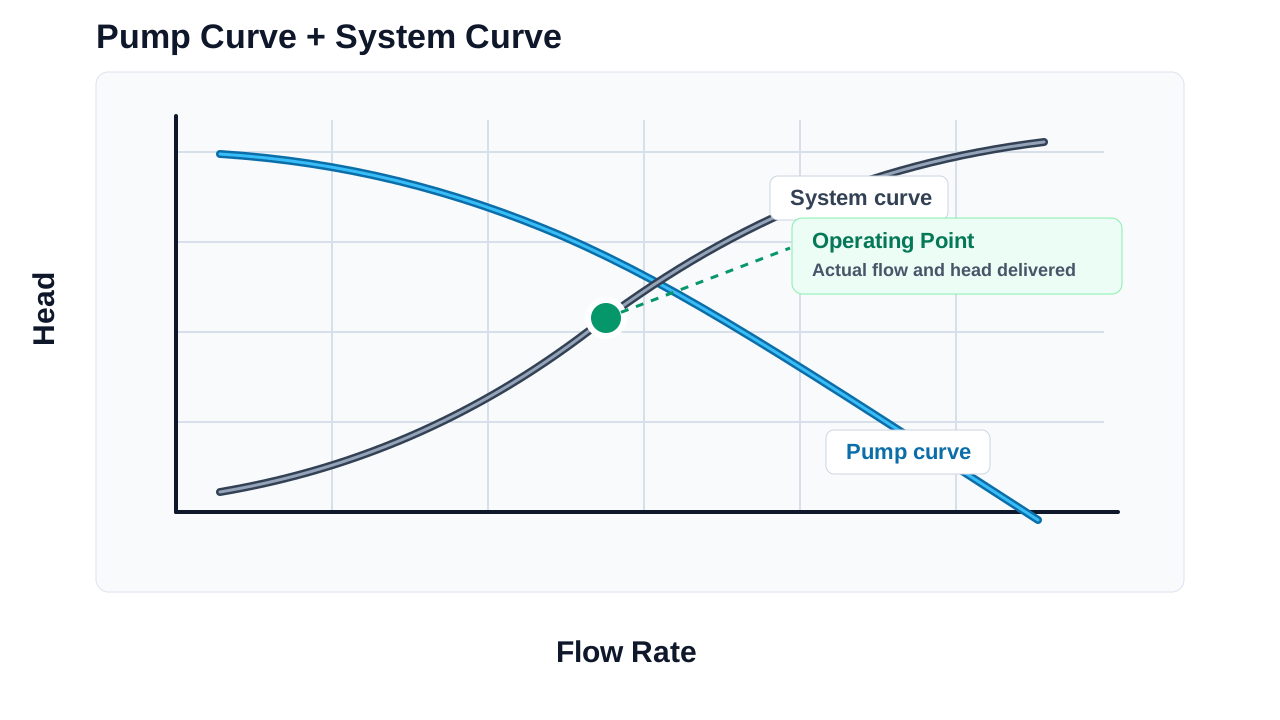
Pump curve and system curve intersecting at the operating point
The operating point is where pump performance and system resistance meet.

The operating point is the point where the pump performance matches the resistance of the connected system.

It is not determined by the pump alone. The system also has its own resistance, which changes as the flow changes.

The intersection between the pump performance curve and the system requirement determines the actual operating condition.

This is why a pump advertised as providing a certain maximum flow should not be assumed to provide that flow after it is connected to a real piping system.

What Is the System Curve?

The system curve represents the amount of head required by the piping system at different flow rates.

System resistance can come from pipe friction, valves, fittings, filters, elevation, pressure requirements, and other restrictions.

As flow increases, friction-related losses generally increase as well. That means the system may require progressively more head to maintain higher flow rates.

The pump and system therefore have to be considered together.

Why Maximum Pump Flow Can Be Misleading

Pump manufacturers may publish a maximum or nominal flow value. However, that number does not necessarily represent the flow available in the actual installation.

A pump may be capable of a high flow when operating against very little resistance. Once connected to a system with long piping, high elevation, valves, filters, or high pressure requirements, the operating point can move to a lower flow.

This is why pump selection should always consider the actual required head.

Example of Flow and Head Trade-Off

Consider a simplified pump curve: 0 L/min at 50 m head, 50 L/min at 45 m, 100 L/min at 38 m, 150 L/min at 29 m, and 200 L/min at 17 m.

At zero or very low flow, the pump can develop a relatively high head. As flow increases, the available head decreases.

If the system requires 100 L/min at approximately 38 m head, the pump may be able to satisfy that operating condition.

But if the system requires 200 L/min at 35 m head, the pump would not be suitable based on this simplified curve because its available head at 200 L/min is much lower.

The actual values for any pump must come from the manufacturer performance data.

Best Efficiency Point

The Best Efficiency Point, or BEP, is the operating region where the pump achieves its highest efficiency.

Operating near the intended BEP can support better energy efficiency, more stable operation, reduced mechanical stress, and better long-term pump performance.

Operating far from the preferred region can increase the risk of undesirable operating conditions.

For this reason, pump selection should consider not only whether the pump can technically reach the required flow and head, but also how efficiently it can operate at that duty point.

Flow Rate, Head, and Pump Power

Flow rate and head also affect pump power.

In this simplified hydraulic power relationship, P is hydraulic power, rho is fluid density, g is gravitational acceleration, Q is flow rate, and H is pump head.

Increasing either flow or head increases the theoretical hydraulic power requirement when the other variables remain unchanged.

Real pumps also have efficiency losses, so shaft power will be higher than hydraulic power.

Formula

P = rho x g x Q x H

How to Evaluate a Pump for a Required Duty

A practical evaluation starts by determining the required flow and required head.

Then define the duty point as a combination such as 100 L/min at 30 m head.

Next, check the manufacturer pump curve, review efficiency near the expected operating point, verify power requirements, and confirm the pump is suitable for expected changes in flow and system conditions.

  • Determine the required flow
  • Determine the required head
  • Define the duty point
  • Check the manufacturer pump curve
  • Check efficiency
  • Check power requirements
  • Verify the operating range

Common Pump Flow and Head Mistakes

  • Looking only at maximum flow
  • Ignoring system resistance
  • Treating head and pressure as the same number
  • Ignoring the pump curve
  • Ignoring efficiency
  • Assuming the operating point is fixed